
Choosing from a range of report options lets you tailor reports to their different purposes.
Here’s a summary of the different sections you can choose to include in your scheduled, search and folder reports.
For more advanced options for pulling reports from your folders, check out the ad-hoc report builder.
HTML and PDF report options
CHARTS / TABLES
Volume chart – If you have lots of news it can be helpful to show a breakdown of content volume across the period.

Volume summary – If you don’t have much news the charts can look a bit empty, so you can use the summary instead. This table will give you the overall total, dates and handy links that jump to the content for each date.

Sources chart – The split of content by sources for the selected period.

Sources summary – This table will give you the overall total for each source, including any ‘Other’ sources if they’ve become too out-of-control to include individually in the Sources chart.

Authors chart – The split of content by authors for the selected period (Tools only).

Authors summary – This table will give you the overall total for each author, including any ‘Other’ authors if they’ve become too out-of-control to include individually in the Authors chart (Tools only).

Content types chart – The split of content by type for the selected period.

Tag charts – The tag bar charts show each of your tag groups tag volume split out by sentiment (Tools only).

NEWS
Content summary – The article headline (which clicks through to the full article online), source, timestamp.
Relevant snippets – The segment/s from the article that include your keyword so you can see the context it appears in.

Intro text – The first paragraph of each article.
Matched keywords – The keyword the article is a match with.
Tags – The tags you or others in your team have added to the content (Tools only).

Full text (TV/Radio digests, PR) – The full text of TV/Radio digests and media releases is included at the end of the report. Use the handy ‘Jump to full text’ link to get to it and then use the ‘Jump to summary’ link to get back up to your place in the report.
Show TV/Radio icons – A TV or radio icon will be added to highlight broadcast content in your reports.
Don’t send duplicates / Hide duplicates – Duplicate articles will be grouped together and you won’t be sent additional duplicates in later reports.

Example for a simple report
Selecting ‘Content Summary’, ‘Relevant snippets, ‘Show TV/Radio icons’ and ‘Don’t send duplicates’ makes a nice simple report. You’ll get something like this:

Example for a report with a range of options selected
If you go for a few more of the options – ‘Content summary’, ‘Relevant snippets’, ‘Intro text’, ‘Matched keywords’, ‘Tags’, ‘Full text’, ‘Show TV/Radio icons’ and ‘Don’t send duplicates’ you’ll get something like this:

CSV report options
Here’s a summary of the different sections you can choose to include in your CSV reports.
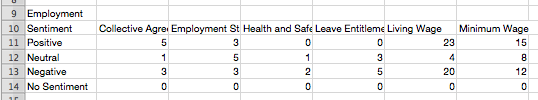
Tag summary – The number of articles tagged with each tag broken down by sentiment. Each tag group is displayed separately.
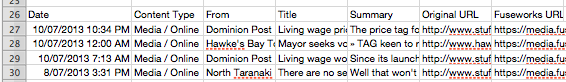
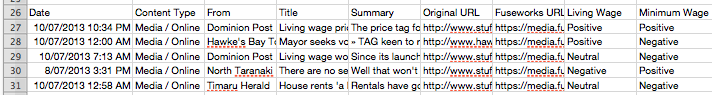
Article list – The raw data for each article in your report.
Tag detail – The article list data plus the tags and sentiment applied to each individual article.
You must be logged in to post a comment.